Note
Go to the end to download the full example code.
Inspect difference of flanking sequence due to splice event#
Given a PTM identified as having an altered flanking sequence in the alternative isoform and/or due to a splice event, it can be usefult o visualize how the sequences differ. We provide functions to compare the flanking sequences of PTMs based on whether an exonic region is included or excluded
from ptm_pose import helpers
from ptm_pose.analyze import flank_analysis as afs

#load example altered flanking sequence data
altered_flanks = helpers.load_example_data(altered_flanks = True)
Let’s say we have identified TSC2 S946 as a site that has an altered flanking sequence due to a skipped exon event, and we want to compare the flanking sequences of the inclusion and exclusion isoforms. First, grab the data for this PTM and print the sequences:
tsc2_s946 = altered_flanks[(altered_flanks['Gene'] == 'TSC2') & (altered_flanks['PTM Position in Isoform'] == 946)].squeeze()

print(f'Inclusion Flanking Sequence: {tsc2_s946["Inclusion Flanking Sequence"]}')
print(f'Exclusion Flanking Sequence: {tsc2_s946["Exclusion Flanking Sequence"]}')
Inclusion Flanking Sequence: NERPKsLRIAR
Exclusion Flanking Sequence: NERPKsRIQTS
This is useful, but is not the most interpretable. We can use the show_sequence_differences function to get a more interpretable view of the differences between the flanking sequences:
afs.plot_sequence_differences(tsc2_s946['Inclusion Flanking Sequence'], tsc2_s946['Exclusion Flanking Sequence'], dpsi = tsc2_s946['dPSI'])
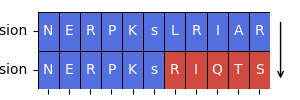
By including the dPSI value, we can see which isoform sequence is more present in the treatment samples. This can be useful for understanding the potential impact of the altered flanking sequence on the PTM.
Total running time of the script: (0 minutes 0.158 seconds)