Note
Go to the end to download the full example code.
Assessing enriched PTM functions#
As described in Running PTM-POSE section, PTM-POSE provides various options for annotating functional information for PTMs, coming from various databases. Often, we will want to dig deeper into the specific functions, processes, interactions, etc. associated with the proteins in our dataset. First, we can look at the annotations currently available for analysis, based on annotations that have been appended using the annotate module:
from ptm_pose import helpers
from ptm_pose.analyze import annotations
import matplotlib.pyplot as plt
import warnings
warnings.filterwarnings("ignore")

spliced_ptms, altered_flanks = helpers.load_example_data(spliced_ptms = True, altered_flanks = True)


annot_categories = annotations.get_available_annotations(spliced_ptms)
annot_categories
This will tell us what database information is available and the types of information from that database. Let’s take a closer look at the biological process information from PhosphoSitePlus:
ptms_with_annotation, annotation_counts = annotations.get_ptm_annotations(spliced_ptms, database = "PhosphoSitePlus", annotation_type = 'Process')
print('Specific PTMs with annotation:')
ptms_with_annotation
3 PTMs removed due to insignificant splice event (p < 0.05, dpsi >= 0.1): (33.33%)
Final number of PTMs to be assessed: 6
Specific PTMs with annotation:
From this, we note a total of 9 impacted PTMs from 7 genes that have biological process information available. While we could manually look through to look for common processes, we can also inspect the annotation counts object to see the most common processes, including a breakdown by the type of impact (included [dPSI > 0], excluded [dPSI < 0], or altered flanking sequence). We can also look at the number of PTMs associated with each annotation:
print('Number of PTMs associated with each annotation:')
annotation_counts
Number of PTMs associated with each annotation:
To better visualize the enriched functions, we can also plot the number of PTMs associated with each function:
#plot annotatinos when not collapsing them
fig, ax = plt.subplots(ncols = 2, figsize = (6, 3))
fig.subplots_adjust(wspace = 2)
annotations.plot_annotation_counts(spliced_ptms =spliced_ptms, altered_flanks = altered_flanks, ax = ax[0], collapse_on_similar = False, database = 'PhosphoSitePlus', annot_type = 'Process', top_terms = 10)
ax[0].set_title('Full Annotation')
#plot annotations when collapsing them
annotations.plot_annotation_counts(altered_flanks = altered_flanks, ax = ax[1], collapse_on_similar = True, database = 'PhosphoSitePlus', annot_type = 'Process', top_terms = 10)
ax[1].set_title('Collapsed Annotation')
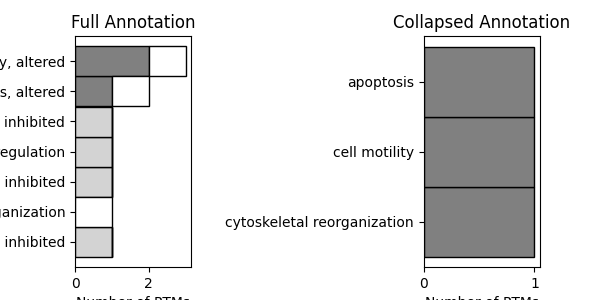
Text(0.5, 1.0, 'Collapsed Annotation')
We can also perform enrichment analysis to identify if any of the functions are more likely to be present then expected, using collapsed annotations to increase likelihood of finding enriched terms:
enrichment = annotations.annotation_enrichment(spliced_ptms, database = 'PhosphoSitePlus', annotation_type = 'Function', collapse_on_similar=True)
enrichment.head()
Total running time of the script: (0 minutes 0.462 seconds)