Note
Go to the end to download the full example code.
Identify enriched gene sets associated with differentially spliced PTMs#
As is commonly done for exon-centric analyses, we have provided the ability to perform gene set enrichment analysis for gene associated with spliced PTMs, using the EnrichR API from the gseapy module. By default, we include gene ontology terms, KEGG pathways, and Reactome pathways, but you can also provide your own gene sets listed in EnrichR.
from ptm_pose import helpers
from ptm_pose.analyze import annotations
import matplotlib.pyplot as plt
import warnings
warnings.filterwarnings("ignore")


# Load spliced ptm and altered flank data
spliced_ptms, altered_flanks = helpers.load_example_data(spliced_ptms = True, altered_flanks=True)
Use the below function, we can identify enriched gene sets associated with spliced ptms, altered flanks, or both. We can also specify the gene sets to assess, alpha value for significance, the minimum change in PSI value to consider, and whether to return only significant gene sets.
genesets = annotations.gene_set_enrichment(spliced_ptms, altered_flanks, alpha = 0.05, min_dPSI = 0.1, gene_sets = ['GO_Biological_Process_2023','Reactome_2022'], return_sig_only = True)
genesets.head()
334 PTMs removed due to insignificant splice event (p < 0.05, dpsi >= 0.2): (69.01%)
Final number of PTMs to be assessed: 150
77 PTMs removed due to insignificant splice event (p < 0.05, dpsi >= 0.2): (51.33%)
Final number of PTMs to be assessed: 73
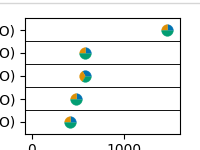
You can then plot the enriched gene sets, including the proportion of genes associated with differentially included PTMs and those with altered flanking sequences. Here, let’s restrict to looking at the top 5 enriched gene sets:
annotations.plot_EnrichR_pies(genesets, top_terms = 5)
plt.tight_layout()
plt.show()
Total running time of the script: (0 minutes 0.680 seconds)