Analysis of PDX Tumor Samples (Huang 2017)#
[1]:
#Supporting packages for analysis
import numpy as np
import pandas as pd

#KSTAR imports
from kstar import config, helpers, calculate
from kstar.plot import DotPlot


#Set matplotlib defaults for arial 12 point font
from matplotlib import rcParams
rcParams['font.family'] = 'sans-serif'
rcParams['font.sans-serif'] = ['Arial']
rcParams['font.size'] = 12
import matplotlib.pyplot as plt

#where supplementary data was downloaded to (From https://figshare.com/articles/dataset/KSTAR_Supplementary_Data/14919726)
SUPPLEMENTS_DIR = './'

#Directory where KSTAR Supplemental data was set
odir = SUPPLEMENTS_DIR+'Supplements/SupplementaryData/BreastCancer/PDX_Huang2017/'

#load the Mann Whitney activities and FPR for Tyrosine predictions,
#it will be faster and less data than loading all KSTAR outputs
activities = pd.read_csv(odir+'/RESULTS/PDX_Y_mann_whitney_activities.tsv', sep='\t', index_col=0)
fpr = pd.read_csv(odir+'/RESULTS/PDX_Y_mann_whitney_fpr.tsv', sep='\t', index_col=0)


#Get information about the samples, such as HER2 status
s1 = pd.read_csv(odir+'Supplementary_Data_1_dataCols.csv')
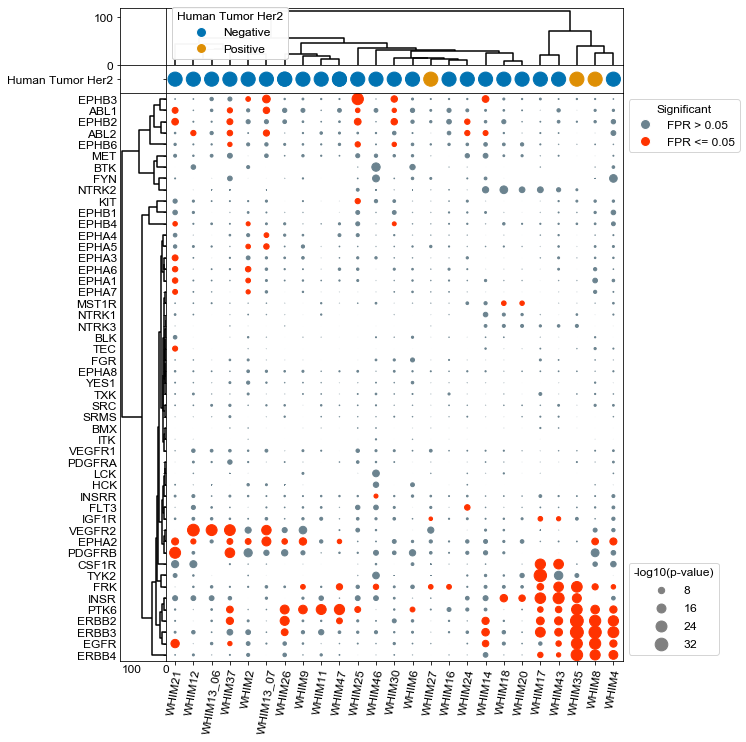
Plot all samples and all kinases, with HER2 status context#
[2]:
# Set the column labels to just have the WHIM labels so it is easier to read (make an x_label_dict)
x_label_dict = {}
for label in activities.columns:
    l = label.strip('data:')
    l_arr = l.split('.')
    if l_arr[0] == 'WHIM13': #there are two WHIM13 samples and they have different results
        x_label_dict[label] = l_arr[0]+'_0'+l_arr[1][-1] #add last one digits
    else:
        x_label_dict[label] = l_arr[0]

#set preferred kinase names (make a kinase_dict)
kinase_dict = {}
for kinase in activities.index:
    kinase_dict[kinase] = conf.KINASE_MAP.loc[kinase,'Preferred Name']
[3]:
alpha = 0.05
results = activities
results = -np.log10(results)
[4]:
#Setup a figure with a context strip at the top for HER2 status and activity dots on the below axis
fig, axes = plt.subplots(figsize = (9, 12),
        nrows = 3, ncols = 2,
        sharex = 'col',
        sharey = 'row',
        gridspec_kw = {
            'height_ratios':[.1,0.05, 1],
            'width_ratios':[0.1,1]
        },)
fig.subplots_adjust(wspace=0, hspace=0)

dots = DotPlot(results,
               fpr,
               alpha=alpha,
               figsize = (9,12),
               dotsize = 5,
               legend_title='-log10(p-value)',
               x_label_dict=x_label_dict,
               kinase_dict = kinase_dict)

#Cluster changes the sorting of the values array, so be sure to plot context last so that it is in the same sort.
dots.cluster(orientation = 'left', ax = axes[2,0], method='ward')
dots.cluster(orientation = 'top', ax = axes[0,1], method='ward')
dots.context(ax=axes[1,1],info = s1, id_column = 'Sample', context_columns = ['Human Tumor Her2'], orientation = 'top', dotsize =200, markersize= 10 )

dots.dotplot(ax = axes[2,1])
plt.xticks(rotation = 80, FontSize=12)
plt.yticks(FontSize=12)
plt.savefig(odir+'PDX_all.pdf', bbox_inches='tight')
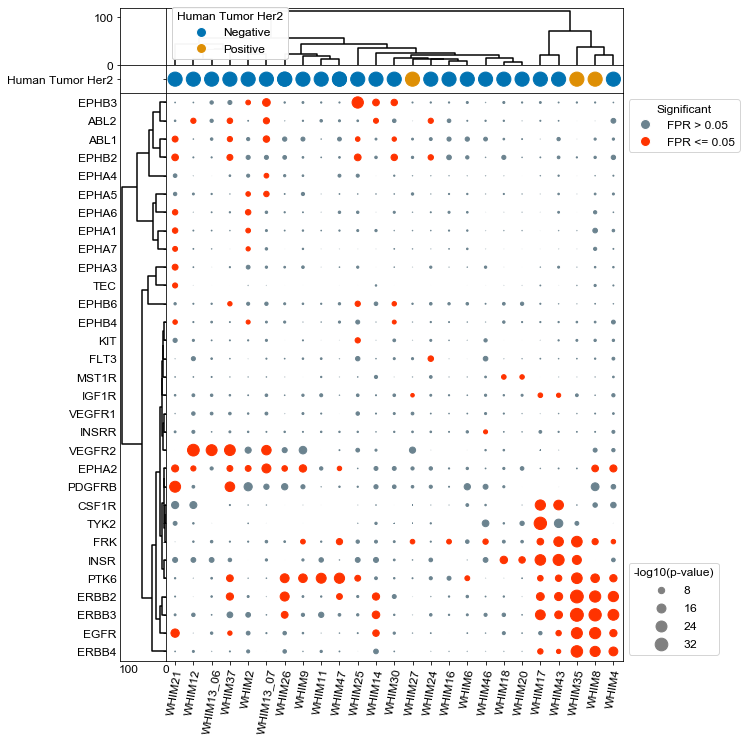
Plot all samples and all significant kinases, with HER2 status context#
[5]:
#Setup a figure with a context strip at the top for HER2 status and activity dots on the below axis
fig, axes = plt.subplots(figsize = (9, 12),
        nrows = 3, ncols = 2,
        sharex = 'col',
        sharey = 'row',
        gridspec_kw = {
            'height_ratios':[.1,0.05, 1],
            'width_ratios':[0.1,1]
        },)
fig.subplots_adjust(wspace=0, hspace=0)

dots = DotPlot(results,
               fpr,
               alpha=alpha,
               figsize = (9,12),
               dotsize = 5,
               legend_title='-log10(p-value)',
               x_label_dict=x_label_dict,
               kinase_dict = kinase_dict)

dots.drop_kinases_with_no_significance()

#Cluster changes the sorting of the values array, so be sure to plot context last so that it is in the same sort.
dots.cluster(orientation = 'left', ax = axes[2,0], method='ward')
dots.cluster(orientation = 'top', ax = axes[0,1], method='ward')
dots.context(ax=axes[1,1],info = s1, id_column = 'Sample', context_columns = ['Human Tumor Her2'], orientation = 'top', dotsize =200, markersize= 10 )

dots.dotplot(ax = axes[2,1])
plt.xticks(rotation = 80, FontSize=12)
plt.yticks(FontSize=12)
plt.savefig(odir+'PDX_nonSignificantDropped.pdf', bbox_inches='tight')
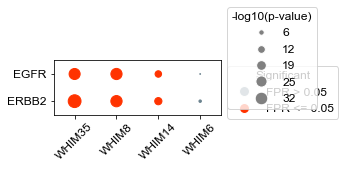
[11]:
# Plot ERBB receptors just for the WHIM lines treated
#from lapatinib treatment

alpha = 0.05

#additional lines
toKeep = {'data:WHIM35.PDXBC08':'WHIM35', 'data:WHIM8.PDXBC01':'WHIM8',
          'data:WHIM14.PDXBC02':'WHIM14', 'data:WHIM6.PDXBC03':'WHIM6'}
results = activities

results = results[toKeep.keys()]
fpr = fpr[toKeep.keys()]
results = -np.log10(results)

kinases = list(results.index)
kinases.remove('EGFR')
kinases.remove('ERBB2')

fig, axes = plt.subplots(figsize = (3,1))
fig.subplots_adjust(wspace=0, hspace=0)

dots = DotPlot(results,
               fpr,
               alpha=alpha,
               figsize = (3,1),
               dotsize = 5,
               legend_title='-log10(p-value)',
               x_label_dict=toKeep)
dots.drop_kinases(kinases)

dots.dotplot(axes, max_size=32)
plt.xticks(rotation = 45, FontSize=12)
plt.savefig(odir+'PDX_WHIM_lapatinibOnly.pdf', bbox_inches='tight')
[ ]: