Note
Go to the end to download the full example code.
Inspecting number of PTMs with annotation information available#
As described in Running PTM-POSE section, PTM-POSE provides various options for annotating functional information for PTMs, coming from various databases. However, PTM functional information is inherently sparse, and so most annotations will only provide information on a handful of PTMs. For this reason, it can be useful to probe how many PTMsTo better understand the types of annotations that are available, as well as the number of PTMs that have an annotation of that type. This can be done using the analyze function in PTM-POSE.
Note: This examples assumes that you have already run the PTM-POSE pipeline and have at annotated PTMs with at least one layer of information.
from ptm_pose import analyze
from ptm_pose import plots as pose_plots
import pandas as pd

# Load spliced ptm and altered flank data
spliced_ptms = pd.read_csv('spliced_ptms.csv')
altered_flanks = pd.read_csv('altered_flanks.csv')

pose_plots.show_available_annotations(spliced_ptms)
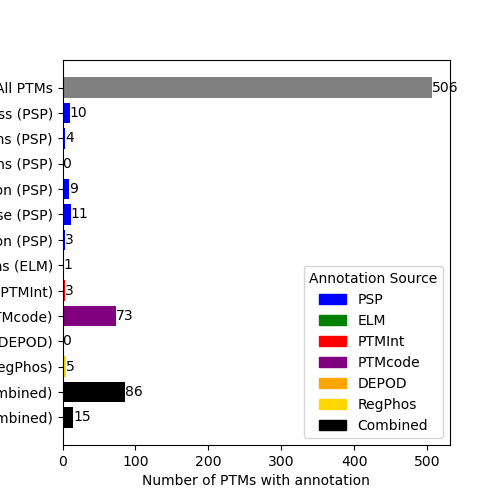
As you can, see there are only a few PTMs from each annotation that have available information, with the most being 9 PTMs out of the 184 differentially included sites having been associated with a biological process. While this this should be taken into consideration when analyzing these annotations, we can glean some useful information and identify potentially interesting proteins/sites to dig deeper into. Let’s look at the PTMs that have been associated with a biological process:
ptms_with_annotation, annotation_counts = analyze.get_ptm_annotations(spliced_ptms, database = "PhosphoSitePlus", annotation_type = 'Process')
print('Specific PTMs with annotation:')
ptms_with_annotation
Specific PTMs with annotation:
We can also look at the number of PTMs associated with each annotation:
print('Number of PTMs associated with each annotation:')
annotation_counts
Number of PTMs associated with each annotation:

PSP:ON_PROCESS
cell motility, altered          3
signaling pathway regulation    2
cell growth, induced            2
apoptosis, altered              1
cell motility, inhibited        1
cytoskeletal reorganization     1
cell adhesion, inhibited        1
carcinogenesis, inhibited       1
cell growth, inhibited          1
autophagy, inhibited            1
carcinogenesis, altered         1
Name: count, dtype: int64
Total running time of the script: (0 minutes 0.159 seconds)